Synopsis, stats & conclusions: Outcomes of planned home births vs planned hospital births after regulation of midwifery in British Columbia, Canada
Outcomes of planned home births versus planned hospital births after regulation of midwifery in British Columbia Patricia A. Janssen et al

This prospective study finds “no statistically significant difference” in any of the measures of safety (ie. percentage of adverse events) for OOH births attended by professionally-trained and regulated midwives when compared to that same groups of professional midwives and MDs attending planned hospital births.
While this is overall a very good find, the midwifery community needs to be able to explain to midwives, parents, journalists, legislators, etc., why 3 perinatal deaths in 862 births was NOT “statistically-significant” (SS), why this is a true and scientifically-accurate statement and what additional number (or range) of OOH perinatal deaths it would take to become statistically significant. The highly-acclaimed and CNM-owned ”
The highly-acclaimed and CNM-owned “Childbirth Connection” website says a neonatal mortality of 1 thru 9 per 1,000 births is below the level of significance from the standpoint of statistical validation. I don’t personally know where that range came from or how it was arrived at.
Here is the specific excerpt from the study:
“The relative risk of perinatal death comparing midwife-attended births at home with physician-attended, planned hospital births was 2.5 (95% confidence intervals 0.27–24.5).
The 95% confidence intervals for the rate of perinatal death for the home birth group {which had 3 deaths} were between 0.9 and 9.0 per thousand births, for the physician comparison group {had 1 death} between 0.1 and 8.9 per thousand births and for the midwife comparison groups {which had no deaths} between 0 and 8.1 per thousand births.”
A secondary issue is the difficult relationship between hospital-based care for normal childbirth, with its routine use of continuous electronic fetal monitoring {EFM), compared with OOH birth attendants who use intermittent auscultation (IA). I have also posted a primer on EFM and IA called: “Everything you don’t want to know about EFM” if anyone is interested in pursuing the topic independently.

The following is my personal statistical analysis and reconfiguration of information to reveal important distinctions between planned places-of-birth and different categories of professional practitioners.
Outcomes of planned home births versus planned hospital births after regulation of midwifery in British Columbia Patricia A. Janssen et al
Abstract
Background
The choice to give birth at home with a regulated midwife in attendance became available to expectant women in British Columbia in 1998. The purpose of this study was to evaluate the safety of home birth by comparing perinatal outcomes for planned home births attended by regulated midwives with those for planned hospital births.
Methods
We compared the outcomes of 862 planned home births attended by midwives with those of planned hospital births attended by either by midwives (n = 571) or physicians (n = 743).
Comparison subjects who were similar in their obstetric risk status were selected from hospitals in which the midwives who were conducting the home births had hospital privileges. Our study population included all home births that occurred between Jan. 1, 1998, and Dec. 31, 1999.
Results
Women who gave birth at home attended by a midwife had fewer procedures during labour compared with women who gave birth in hospital attended by a physician.
After adjustment for maternal age, lone parent status, income quintile, use of any versus no substances and parity, women in the home birth group were less likely to have epidural analgesia (odds ratio 0.20, 95% confidence interval [CI] 0.14–0.27), be induced, have their labours augmented with oxytocin or prostaglandins, or have an episiotomy.
Comparison of home births with hospital births attended by a midwife showed very similar and equally significant differences. The adjusted odds ratio for cesarean section in the home birth group compared with physician-attended hospital births was 0.3 (95% CI 0.22–0.43).
Rates of perinatal mortality, 5-minute Apgar scores, meconium aspiration syndrome or need for transfer to a different hospital for specialized newborn care were very similar for the home birth group and for births in hospital attended by a physician.
The adjusted odds ratio for Apgar scores lower than 7 at 5 minutes in the home birth group compared with physician-attended hospital births was 0.84 (95% CI 0.32–2.19).
My synopsis, statistical display & conclusions:
Outcomes of 2,177 planned home births vs planned hospital births
after regulation of midwifery in British Columbia 1998-1999
 Total numbers: 862 planned home births attended by midwives
1,333 planned hospital births attended by either by midwives (571) or physicians (743).
Key to my abbreviations:
PHB = planned home birth; mf = midwife; MD = a physician provider group attending planned hospital births — includes family practice physicians, obstetricians, medical residents and medical students under supervision
AVD = operative or ‘assisted” vaginal birth (forceps or vacuum extraction
Data taken from Table #2
Spon. NSVD PHB-mf = 90.4% // mf-hosp birth = 75.8% // MD-hosp = 68.4%
Assisted Vag birth hosp PHB-mf = 3.2% // mf-hosp birth = 12.3% // MD-hosp = 13.5%
Overall CS rate PHB-mf = 6.4% // mf-hosp birth = 11.9% // MD-hosp birth =18.2%
Primigravida CS PHB-mf = 11.2% // mf-hosp birth = 15.4% // MD-hosp birth = 21.5%
Primary indication
for CS ~ Fetal distress PHB-mf = 1.3% // mf-hosp = 2.1% // MD-hosp = 3.6%
Epidural or Spinal anes. PHB-mf = 10.7% // mf-hosp = 32.8% // MD-hosp = 37.2%
Episiotomy PHB-mf = 3.8% // mf-hosp = 10.9% // MD=hosp = 15.3%
For a data of set 2,176 essentially healthy childbearing women whose personal medical and pregnancy status met the criteria for midwife-attended birth in an OOH setting
The overall percentages of NSVD in both settings and under the care of both midwives and physicians = was 78.2%
Aggregate total for spontaneous vaginal births inboth settings (home & hospital) and for
both providers = 78.2%
Average NSVD rate for all midwife-attended spontaneous births
(both OOH and hospital) = 83.1%
Average CS & AVD rate for all midwife-attended births
(both OOH and hospital) = 16.9%
Physician rate
NSVD = 68.4%
CS & AVD = 27.9
Average by Caregiver category (all settings):
NSVD
Midwives overall rate = 83.1%
Physicians overall rate = 68.4%
Operative delivery – CS & Assist vag del]
Midwives = 16.9%
Physicians = 27.9%
Averaged by Planned place-of-birth (all categories of birth attendants)
NSVD
Hospital = 72.1%
OOH* = 90.4%
Operative delivery – CS & AVD
Hospital = 27.9%
OOH = 9.6%
Midwives* (only) in an OOH setting
…………………………………….NSVD = 90.4%
………………………..CS & AVD rate = 9.6% ( 2 1/2 times less than hosp. midwives & 3 ½ times less than physician care- same cohort of women with the same health status)
NOTE: This rate is 2 1/2 times less than hosp. midwives, and 3 ½ times less than physicians while providing care to the same cohort of women with the same health status)
Midwives** in hospital
……………………………………NSVD = 75.8%;
…………………………CS & AVD rate = 24.2% (2 1/2 greater than OOH rate)
Physicians/hospital
………………………………………NSVD = 68.4%;
………………………….CS & AVD rate = 32.6% (3.4 fold greater than OOH rate)
 A significant disparity in the actual numbers of birth attended by midwives when compared to numbers ascribed to them in the study, as a large number in both settingd were actually delivered by physicians, nurses ‘others’ or unattended.
- * In the home births, 110 (12.8%) were delivered by physicians, 8 (0.9%) by “other” persons (qualified second attendants, usually nurses, attended deliveries when back-up midwives were not available) and 6 (0.7%) were unattended (total on non-midwife deliveries 14.4%).
** In the hospital-midwife comparison group, 167 (29.2%) of these mothers were delivered by physicians, nurses and ‘other’. Hospital midwives attended only 404 births or 70.8%. This means that the hospital-midwife cohort of 404 birth was 50% less than 862 OOH births in midwife group.
This disparity makes it difficult to tell if the higher number of labor interventions and operative deliveries ascribed the hospital midwives compared to OOH midwives is actually relevant (numbers are significantly more for hospital midwives than the same professional group of midwives who attended the 862 PHB), or is just a fluke?
Data on hospital transport:

Which one of these puppies goes?
not completed requirements for registration (1)

Perinatal deaths
2 stillbirths & 1 neonatal death in the physician comparison group
 Five babies in the home birth group required assisted ventilation for more than 24 hours, compared with NONE in either comparison group.
Among these five cases was the baby who died in the neonatal period from hypoxic ischemic encephalopathy and other major organ damage that was indicated a pre-labor origin.
Two babies in the home birth group had meconium aspiration syndrome, another was thought to have aspirated clear amniotic fluid, and the fifth was diagnosed with meconium aspiration, even though none was seen during labor.
 Rates of low Apgar scores at 5 minutes did not differ among the groups. Rates of thick meconium at birth did not differ among the groups. Drugs for neonatal resuscitation were used more frequently among the physician comparison group.
There were 3 sets of twins delivered in the home birth group (data not shown). One set was delivered in hospital …
… the other 2 were undiagnosed prior to delivery and delivered at home. Apgar scores for twins delivered at home were 7 or more at one minute and 8 or more at 5 minutes. There were no babies delivered at home with breech presentation.
Two mothers with cases of breech presentation were transported to hospital as an emergency transport during labour. A controlled multivariate analysis of selected outcomes did not reveal any additional significant associations (Table 3).
Maternal Complications (there were no mortalities)
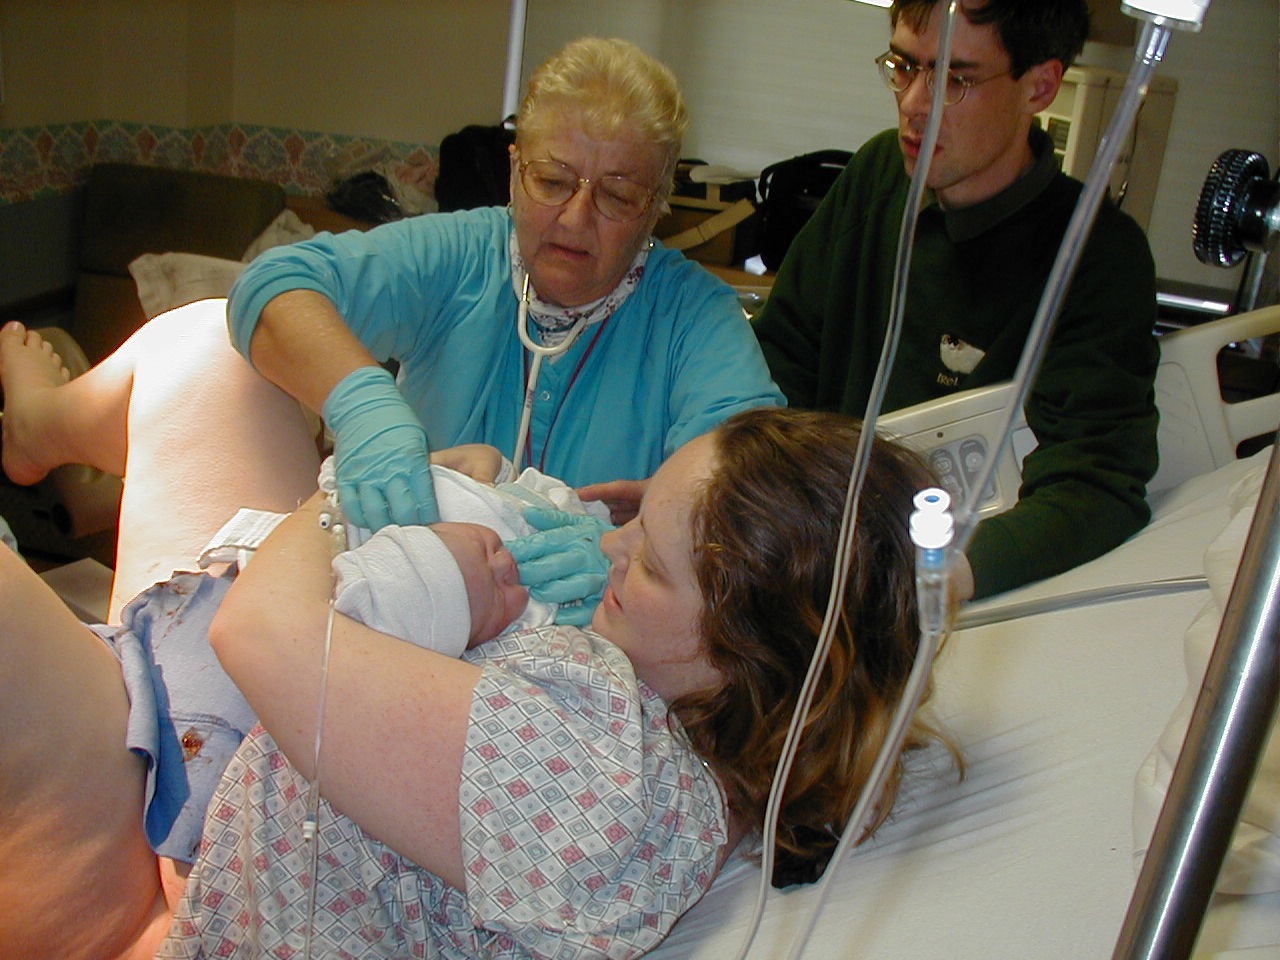
New mother in hospital with IVs running for to control or prevent excessive bleeding after the birth
Of the 4 patients who required blood transfusions, 3 were in the planned home birth group.
Both of cases of obstetric shock occurred at home, while there were NONE in either the MD or hospital-midwife comparison groups.
 Conclusions provided by the study’s author:
Comparison of home births with hospital births attended by a midwife showed very similar and equally significant differences.
- epidural analgesia (odds ratio 0.20, 95% confidence interval [CI] 0.14–0.27)
- be induced
- labours augmented with oxytocin or prostaglandins,
- an episiotomy.
BABIES:
Rates of perinatal mortality, 5-minute Apgar scores, meconium aspiration syndrome or need for transfer to a different hospital for specialized newborn care were very similar for the home birth group and for births in hospital attended by a physician.
The adjusted odds ratio for Apgar scores lower than 7 at 5 minutes in the home birth group compared with physician-attended hospital births was 0.84 (95% CI 0.32–2.19).
There was no increased maternal or neonatal risk associated with planned home birth under the care of a regulated midwife.
However, the consequences of some of the expected complications (thick meconium in the amniotic fluid and maternal PP hemorrhage) may be more serious for women and their babies when women deliver at home than when they deliver in hospital.